





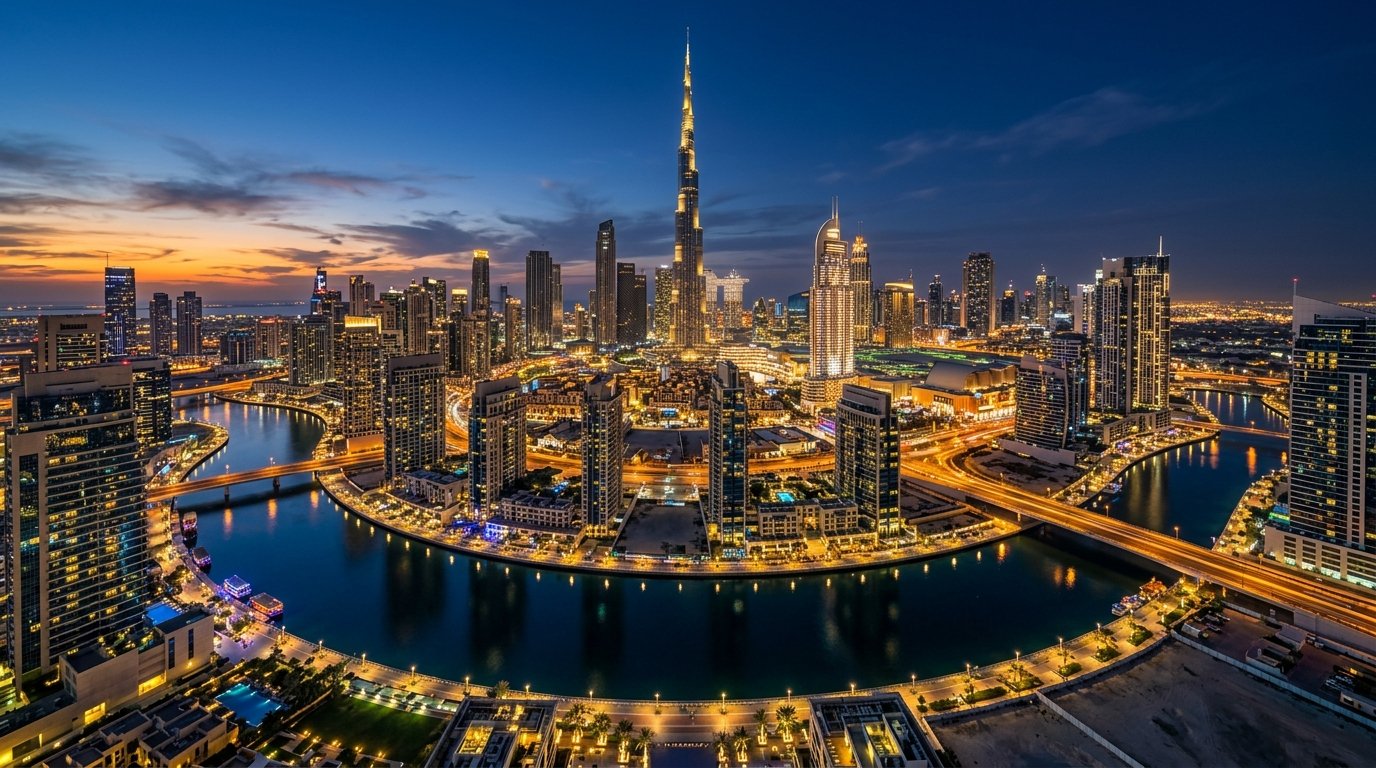
As Dubai’s property market enters its fifth consecutive year of historic price appreciation, one urgent question dominates executive boardrooms, family office roundtables, and international investor forums: Is Dubai real estate in a bubble, and is a severe market correction imminent in 2026? Having surged past previous peak valuations recorded in 2014, prime villa prices in enclaves like Palm Jumeirah and Emirates Hills have expanded by over 120%, while urban apartment values have climbed by more than 60% since early 2021. For seasoned market observers haunted by memories of the 2008 global financial crisis and the 2014 oil-price slump, alarms are naturally sounding.
However, a rigorous macroeconomic autopsy of Dubai’s contemporary real estate ecosystem reveals that today’s market dynamics are fundamentally decoupled from historical boom-and-bust cycles. Rather than being fueled by speculative debt, predatory mortgage lending, or unregulated secondary-market flipping, the current expansion is fortified by unprecedented demographic migration, structural regulatory overhauls by the Dubai Land Department (DLD), robust sovereign policy initiatives, and an overwhelming dominance of equity-funded, cash-settled transactions.
This comprehensive white paper conducts an exhaustive, data-driven analysis of Dubai’s 2026 property market fundamentals. Drawing upon historical transaction registries, UBS Global Real Estate Bubble Index benchmarks, construction delivery timelines, population growth trajectories under the Dubai 2040 Urban Master Plan, and cash-to-mortgage leverage ratios, this dossier provides institutional investors with the definitive empirical framework to distinguish between irrational speculative euphoria and authentic structural repricing.
1. Defining an Asset Bubble: Academic Criteria vs. Dubai Market Realities
To assess whether Dubai property is experiencing a bubble, one must first establish the economic definition of an asset bubble. According to classical econometric definitions advanced by Nobel laureate Joseph Stiglitz and the Bank for International Settlements (BIS), a real estate bubble occurs when asset prices rise substantially above their fundamental intrinsic value, driven primarily by speculative expectations of future price increases rather than underlying cash flows, user utility, or rental income capacity.
Historically, asset bubbles exhibit four unmistakable structural hallmarks:
- Excessive Credit Expansion: Buyers rely heavily on high-leverage bank financing, subprime borrowing, or loose lending standards to purchase properties they cannot fundamentally afford.
- Severe Yield Compression: Property prices surge while rental rates stagnate or decline, driving gross rental yields to negligible levels (e.g., below 2% to 3%), making property holding entirely dependent on speculative capital gains.
- Unabsorbed Ghost Inventory: Physical supply substantially outpaces genuine demographic absorption, resulting in surging vacancy rates across completed projects.
- Uncontrolled Speculative Flipping: Contracts are bought and sold multiple times on minimal deposits before physical foundation works even commence, without end-user occupancy intention.
When these empirical benchmarks are applied to Dubai’s current market, the bubble thesis rapidly dissolves. Gross rental yields across Dubai remain extraordinarily healthy at 6.5% to 9.2%, rental rates have matched or outpaced sales price inflation, more than 75% of all transactions are transacted in pure cash, and Dubai’s net population is expanding by more than 100,000 new residents annually, absorbing physical handovers at record-breaking velocity.
2. Historical Anatomy: Why 2026 is Structurally Decoupled from 2008 and 2014
Skeptics routinely draw parallels between Dubai’s current market momentum and the crashes of 2008 and 2014. However, treating these historical cycles as equivalent ignores profound structural, legislative, and institutional evolutions that have reshaped the UAE economy over the past two decades.
The 2008 Crash: The Era of Unregulated Wild West Flipping. In 2008, Dubai’s freehold real estate framework was in its infancy. There were no mandatory escrow accounts for developers, mortgage loan-to-value (LTV) ratios routinely reached 90% to 95% (with banks even financing the 4% transfer fee), and off-plan contracts were flipped multiple times on a mere 5% down payment within weeks. When the Lehman Brothers collapse triggered an abrupt global credit freeze, speculative buyers with zero balance-sheet liquidity defaulted en masse, causing unfinished projects to stall and asset prices to plummet by over 50% within twelve months.
The 2014 Correction: Commodity-Driven Liquidity Contraction. In 2014, Dubai experienced a milder cyclical correction driven by macroeconomic external shocks: Brent crude collapsed from $115 per barrel to under $30, severely shrinking regional GCC sovereign liquidity. Simultaneously, the US dollar strengthened dramatically (pegging the UAE Dirham higher), making Dubai property 30% more expensive for European, Russian, and emerging-market buyers. Coupled with a massive wave of concurrent supply completions, property values softened gradually by 25% to 30% between 2015 and 2019.
The 2026 Paradigm: Structural Institutional Maturity. Today, Dubai operates under a fortified legal and regulatory architecture designed specifically to eliminate systemic vulnerabilities. Mandatory project escrow accounts (Law No. 8 of 2007) protect 100% of investor capital, the UAE Central Bank enforces strict mortgage caps (maximum 80% LTV for expatriates, requiring 20% hard cash equity), and the DLD enforces a minimum 30% to 40% paid equity threshold before any off-plan contract can be legally reassigned. Most importantly, Dubai’s economic reliance on oil has shrunk to under 1% of GDP, replaced by high-growth knowledge, logistics, tourism, and financial service industries.
| Market Structural Metric | 2008 Peak (Pre-Crash) | 2014 Peak (Pre-Softening) | 2026 Current Baseline | Systemic Risk Impact |
|---|---|---|---|---|
| Financing Method | 65% – 70% Highly Leveraged Mortgages | 45% Mortgages / 55% Cash | 78% – 82% Direct Cash & Equity | Immense Resilience to Rate Hikes |
| Off-Plan Resale Rules | Flipping permitted on 5% deposit | Flipping permitted on 20% deposit | Strict 30% – 40% Paid Equity NOC | Elimination of Speculative Default |
| Escrow Account Mandate | Non-existent / Voluntary | Implemented but developing | 100% Mandatory RERA-audited Escrow | Full Capital Ring-Fencing |
| Residency & Visa Security | Tied strictly to corporate employment | Short-term 2-year property visa | 10-Year Unconditional Golden Visa (AED 2M) | Long-Term Wealth Anchoring |
| Average Gross Rental Yield | 4.5% – 5.2% (Yield Compressed) | 5.0% – 5.8% | 6.8% – 8.8% (Highly Attractive) | Underlying Cash Flow Support |
| Buyer Profile | Short-term speculative flippers | Regional GCC investors | Global HNWIs, end-users & family offices | High Net Worth Permanent Residents |
As evidenced by this comparative matrix, the institutional foundation supporting Dubai’s 2026 property market is radically superior to any prior era. Rather than a fragile house of cards constructed on bank credit, the market represents an equity-rich fortress funded by international capital seeking geopolitical safety, asset diversification, and tax efficiency.
3. The UBS Global Real Estate Bubble Index: Empirical International Benchmarks
The most authoritative global benchmark evaluating property bubble risk is the annual UBS Global Real Estate Bubble Index. Published by UBS Global Wealth Management, the index evaluates housing markets across 25 major financial capitals using rigorous econometric indicators, including price-to-income ratios, price-to-rent ratios, changes in mortgage debt-to-GDP, changes in construction-to-GDP, and relative price-to-country indicators.
Under the UBS scoring methodology, markets are classified into four risk categories:
- Bubble Risk: Score above 1.50 (Extreme risk of severe price correction).
- Overvalued: Score between 0.50 and 1.50 (Moderate valuation risk).
- Fairly Valued: Score between -0.50 and 0.50 (Sound equilibrium).
- Undervalued: Score below -0.50 (Depressed asset pricing).
In the latest edition of the UBS Global Real Estate Bubble Index, Dubai scored 0.64, placing it in the low-overvalued / near-fairly valued territory. By comparison, major Western and Asian metropolitan centers scored significantly higher on the bubble risk spectrum, facing acute risks of housing market contraction:
| Global City | UBS Bubble Index Score | Risk Classification | Avg Price / Sq. Ft. (USD Equivalent) | Average Gross Rental Yield (%) |
|---|---|---|---|---|
| Miami | 1.79 | Bubble Risk (Highest in Americas) | $1,150 / sq. ft. | 4.5% |
| Tokyo | 1.67 | Bubble Risk | $1,320 / sq. ft. | 3.2% |
| Zurich | 1.45 | Elevated Overvaluation | $1,850 / sq. ft. | 2.7% |
| Geneva | 1.33 | Elevated Overvaluation | $1,720 / sq. ft. | 2.9% |
| Los Angeles | 1.17 | Overvalued | $950 / sq. ft. | 4.8% |
| London | 0.78 | Moderate Overvaluation | $1,650 / sq. ft. | 3.6% |
| Dubai | 0.64 | Low Overvaluation / Robust Fundamentals | $490 / sq. ft. (AED 1,800) | 7.6% (Highest Globally) |
| New York | 0.43 | Fairly Valued | $1,480 / sq. ft. | 4.2% |
The UBS empirical findings illustrate two critical structural facts: First, Dubai’s price-to-income and price-to-rent ratios remain exceptionally healthy. Second, at an average prime valuation of roughly $490/sq.ft. (AED 1,800), Dubai remains remarkably affordable on a global comparative basis—trading at a 60% to 70% discount compared to London, Zurich, New York, and Hong Kong, despite offering superior tax advantages, premier modern infrastructure, and world-leading public safety.
4. The 80% Cash Buyer Reality: Immunity to Global Interest Rate Shocks
The defining vulnerability of conventional real estate bubbles is debt leverage. When central banks raise benchmark interest rates to combat inflation, mortgage borrowing costs surge, buyer purchasing power contracts, monthly debt servicing burdens balloon, and forced seller liquidations trigger an asset deflation cycle. This exact dynamic crippled housing markets across the United States, Canada, the United Kingdom, and Germany between 2022 and 2025.
In stark contrast, Dubai’s property market proved astonishingly impervious to the US Federal Reserve’s aggressive monetary tightening cycle (which the UAE Central Bank mirrors due to the Dirham-to-USD currency peg). How did Dubai record all-time high transaction volumes and price appreciation during a period of 5.5% benchmark interest rates?
The answer lies in Dubai’s unparalleled capital structure. According to official Dubai Land Department transaction registries, between 78% and 82% of all residential property transactions in Dubai are executed entirely in cash, without bank debt. In the ultra-luxury segment (properties valued above AED 15 million), cash transaction rates exceed 92%.
| Year | Total DLD Sales Value (AED Billion) | Cash / Equity Purchases (%) | Mortgage-Backed Transactions (%) | Total Sales Transactions |
|---|---|---|---|---|
| 2021 | AED 151.0 Billion | 74.2% | 25.8% | 61,241 |
| 2022 | AED 265.6 Billion | 77.8% | 22.2% | 97,489 |
| 2023 | AED 412.3 Billion | 80.5% | 19.5% | 133,134 |
| 2024 | AED 528.0 Billion | 81.6% | 18.4% | 168,500 |
| 2025 – 2026 Run-Rate | AED 610.0+ Billion | 79.4% | 20.6% | 185,000+ |
Because four out of every five properties in Dubai carry zero bank debt, the market is fundamentally immune to systemic mortgage defaults or forced bank foreclosures. Even during macroeconomic headwinds, property owners are under zero banking pressure to liquidate assets at fire-sale discounts. This massive equity foundation establishes an impenetrable structural pricing floor.
5. The Supply Pipeline vs. Demographic Inflow: Deconstructing the “Oversupply” Myth
The most frequent bear argument raised against Dubai property is the looming wave of off-plan handovers. Skeptics point to developer project launch statistics and argue that tens of thousands of new units scheduled for delivery between 2026 and 2028 will flood the rental market, crater tenancy yields, and trigger a sharp price drop.
However, examining headline developer projections without adjusting for historical delivery realization rates and demographic population absorption leads to deeply flawed conclusions:
1. The Construction Delivery Realization Gap
Historical data compiled by REIDIN and JLL demonstrates that Dubai developers consistently deliver only 60% to 70% of announced pipeline inventory within the scheduled calendar year. Construction logistics, supply chain delays, MEP procurement, and rigorous DLD inspection standards routinely push 30% to 40% of anticipated completions into subsequent years. A projected delivery pipeline of 80,000 units in a given year realistically translates to approximately 52,000 to 56,000 physical handovers.
2. Dubai’s Exponential Population Inflow
According to the Dubai Statistics Center, Dubai’s resident population surpassed 3.75 million in 2024 and is currently expanding at a rapid clip of 105,000 to 125,000 net new residents per year. Under the statutory mandates of the Dubai 2040 Urban Master Plan, the emirate’s population is officially projected to reach 5.8 million residents by 2040.
Assuming an average household occupancy density of 2.4 persons per residential unit, Dubai requires a baseline delivery of approximately 45,000 to 52,000 new residential units annually simply to satisfy organic demographic population growth. When factoring in the demolition of aging legacy districts and the rapidly expanding short-term holiday home market (which permanently removes thousands of residential units from the long-term rental pool), physical supply and organic demand remain in near-perfect equilibrium.
| Year | Net Population Addition | Organic Housing Demand (Units) | Projected Completions | Actual Realized Deliveries (Est.) | Market Balance Status |
|---|---|---|---|---|---|
| 2023 | +102,000 | ~42,500 Units | 55,000 | 39,200 Units | Severe Under-supply (Rents +24%) |
| 2024 | +115,000 | ~47,900 Units | 67,000 | 46,500 Units | Tight Market (Rents +14%) |
| 2025 | +120,000 | ~50,000 Units | 78,000 | 53,000 Units | Balanced Absorption |
| 2026 (Forecast) | +125,000 | ~52,000 Units | 89,000 | 59,000 Units | Slight Surplus / Stable Yields |
| 2027 (Forecast) | +130,000 | ~54,100 Units | 94,000 | 62,000 Units | Healthy Equilibrium |
Rather than precipitating a catastrophic bubble collapse, the 2026 supply delivery schedule will simply serve as a healthy normalization valve. It will transition Dubai from an unsustainable 20%+ annual rental surge into a stable, sustainable market regime characterized by 4% to 6% annual rental growth and stable high single-digit net yields.
6. Geographic and Segment Bifurcation: Where Does Real Market Risk Lie?
One of the most dangerous mistakes an investor can make is treating Dubai as a single, monolithic real estate market. In reality, Dubai is sharply bifurcated into distinct submarkets exhibiting vastly divergent risk-reward dynamics.
A granular analysis reveals that bubble risks do not threaten prime luxury or mature central districts; rather, vulnerability is concentrated exclusively in generic, high-density outer suburban off-plan developments launched by unproven private builders:
| Submarket Classification | Representative Prime Districts | Supply Pipeline Elasticity | 2026 Risk Assessment | Forward Outlook |
|---|---|---|---|---|
| Prime Waterfront & Trophy Assets | Palm Jumeirah, Jumeirah Bay Island, Bluewaters, Dubai Canal | Extremely Inelastic (Virtually Zero New Land) | Zero Bubble Risk | Continuous compounding capital growth driven by global HNWI scarcity demand |
| Central Established Urban Core | Downtown Dubai, Business Bay, Dubai Marina, DIFC | Low to Moderate (Limited Infills) | Very Low Risk | High tenant liquidity, premier occupancy (>90%), stable 6.5% – 7.5% net yields |
| Master-Planned Villa Communities | Dubai Hills Estate, Arabian Ranches 3, Tilal Al Ghaf | Controlled by Tier-1 Masters (Emaar, Majid Al Futtaim) | Very Low Risk | Sustained family end-user demand; structural shortage of standalone green villas |
| Outer Suburban Apartment Corridors | JVC (Jumeirah Village Circle), Arjan, Dubailand, Dubai South | Highly Elastic (Abundant Available Land) | Moderate Overheating Risk | Potential 5% – 10% rent softening upon concurrent 2026/2027 handover waves |
| Generic Tier-3 Private Developer Off-Plan | Isolated non-master-planned plots in peripheral desert corridors | High Execution & Resale Risk | Elevated Vulnerability | Secondary-market liquidity bottlenecks; risk of construction handover delays |
As highlighted in the matrix, the primary risk facing investors in 2026 is not a market-wide crash, but submarket misallocation. Capital committed to tier-one master-planned communities, beachfront assets, and prime urban enclaves will continue to benefit from severe physical supply scarcity, while speculative buyers who purchased peripheral, generic apartments on post-handover payment plans may face sluggish secondary resale liquidity.
8. Monetary Architecture: EIBOR, Central Bank Lending Norms, and Mortgage Stress Testing
While cash transactions represent the overwhelming majority of market volume, understanding the health of the mortgage-financed segment is vital for evaluating systemic banking stability. In Western housing markets, floating-rate subprime mortgages and adjustable-rate products (ARMs) triggered the catastrophic domino effect of the 2008 Great Financial Crisis. In Dubai, the mortgage sector is protected by some of the most conservative macroprudential regulations enforced anywhere in the developed financial world.
Under Central Bank of the UAE (CBUAE) regulatory mandates, expatriate buyers face a strict statutory Loan-to-Value (LTV) ceiling of 80% for primary residential properties valued under AED 5 million, requiring a mandatory 20% personal equity contribution in hard cash, plus approximately 7% in upfront transaction costs (4% DLD fee, 2% broker commission, and administrative fees). For properties valued above AED 5 million, the maximum LTV drops to 70%, and for secondary or investment properties, LTV is capped at 60%.
Furthermore, UAE retail and private banks are legally obligated to stress-test prospective borrowers at interest rates 200 to 300 basis points above the prevailing Emirates Interbank Offered Rate (EIBOR). This ensures that even in an aggressive rate-hiking environment where benchmark rates climb to 5.5% or 6.0%, borrowers possess verified debt-burden ratios (DBR capped at 50% of verifiable monthly income) capable of absorbing rate shocks without defaulting. Consequently, non-performing mortgage loan (NPL) ratios across UAE national banks currently hover at historic lows below 2.2%, providing an ironclad bulwark against banking-sector contagion.
9. Macro Catalysts: The Dubai D33 Economic Agenda & Trillion-Dirham Infrastructure Multipliers
A real estate asset bubble exists when property price expansion occurs in a macroeconomic vacuum without underlying economic growth. In Dubai, real estate appreciation is directly underpinned by the execution of the Dubai Economic Agenda (D33), a transformative master strategy spearheaded by His Highness Sheikh Mohammed bin Rashid Al Maktoum to double the size of Dubai’s economy to AED 32 trillion ($8.7 trillion) by 2033 and position Dubai among the top three global economic cities.
The D33 agenda is supported by multi-billion-dollar sovereign infrastructure projects that are actively creating new economic corridors and accelerating real estate land valuations across the emirate:
- Al Maktoum International Airport (DWC) $35 Billion Expansion: The greenlighted master plan will transform DWC into the world’s largest aviation hub, featuring 400 aircraft gates, five parallel runways, and a passenger capacity exceeding 260 million travelers annually. This mega-hub shifts the economic gravity of Dubai southwards, generating over 150,000 high-income executive jobs and creating structural housing demand across Dubai South, Expo City, and surrounding communities.
- The Dubai Metro Blue Line Expansion (AED 18 Billion): Spanning 30 kilometers with 14 stations, the Blue Line directly links Dubai International Airport to major growth centers including Dubai Creek Harbour, Dubai Silicon Oasis, Academic City, and Ras Al Khor. Transit-oriented development (TOD) economic models demonstrate that properties located within 800 meters of transit lines experience a 12% to 18% valuation premium over non-transit-connected developments.
- DIFC 2.0 and Family Office Influx: The Dubai International Financial Centre (DIFC) has recorded exponential expansions, with over 1,000 active wealth and asset management entities, family offices, and hedge funds managing trillions in assets. Institutional wealth managers from London, Geneva, Singapore, and New York are establishing primary operations in Dubai, driving sustained corporate demand for luxury commercial office space and ultra-prime residential housing.
- Etihad Rail Passenger Integration: Linking all seven emirates through high-speed 200 km/h passenger rail, the federal network integrates Dubai seamlessly into the broader UAE economy, enabling friction-free mobility between Abu Dhabi, Dubai, Sharjah, and Ras Al Khaimah.
10. Sovereign Geopolitics & Institutional Capital Migration: Dubai as the World’s Safe Haven
To comprehend why capital continues to pour into Dubai at an unprecedented velocity, one must examine the deteriorating geopolitical and fiscal landscape across traditional Western and Asian economies:
Global Wealth Taxation Flight
Across the UK, Europe, and the United States, sovereign governments are aggressively pursuing wealth redistribution policies, raising capital gains taxes, abolishing non-domiciled tax regimes (as seen in the UK), and proposing wealth levies. Dubai stands as a beacon of fiscal sanity, offering 0% personal income tax, 0% capital gains tax, 0% inheritance tax, and 0% property holding taxes. This tax differential provides high-net-worth investors with an immediate 30% to 50% compounding yield advantage over European or American holdings.
Geopolitical Neutrality and Safety
In an increasingly polarized global order marked by regional conflicts, banking instabilities, and capital controls, the UAE has maintained rigorous, non-aligned diplomatic neutrality. Dubai has established itself as the premier global safe harbor for international wealth originating from Europe, the UK, India, China, the Commonwealth of Independent States (CIS), and Latin America. Ranking consistently among the top five safest cities on earth, Dubai offers an unmatched quality of life, premier healthcare, and world-class international schooling.
The 10-Year Golden Visa Structural Multiplier
Historically, expatriates viewed Dubai as a temporary transit lounge where they worked for 3 to 5 years before repatriating capital to their home countries. The introduction of the 10-Year Renewable Golden Visa (unlocked with an AED 2,000,000 property investment) transformed Dubai into a permanent home. Expatriates are liquidating assets abroad to purchase primary residences in Dubai, enrolling children in long-term schooling, establishing family offices, and anchoring generational wealth in local real estate.
8. Stress-Testing 2026–2028: Three Realistic Market Scenarios
Rather than indulging in binary “boom or doom” hyperbole, institutional investors rely on scenario modeling to project expected returns across different economic states of the world:
Scenario A: Structural Consolidation & Healthy Normalization (Probability: 65%)
Mechanics: Property price growth cools from rapid double-digit rates (+15% to +20%) to a sustainable compounding annual pace of 5% to 8%. Rental growth stabilizes between 3% and 5% as 2026 handovers enter the market. Prime waterfront and master-planned villas continue to command modest premiums (+8% to +12%), while outer suburban apartments experience yield plateauing. Gross rental yields stabilize at a healthy 7.0% to 7.5%. This represents the most probable base-case trajectory.
Scenario B: Continued Bullish Acceleration (Probability: 25%)
Mechanics: Further global monetary easing (Fed rate cuts) sparks an aggressive influx of international mortgage and institutional private equity capital. Major federal infrastructure milestones (Al Maktoum International Airport DWC expansion, Dubai Metro Blue Line ground-breaking, Wynn Al Marjan opening) trigger a secondary speculative wave. Prime luxury values expand by another 12% to 18%, pushing Dubai closer to fair-value parity with Singapore and London.
Scenario C: Mild Cyclical Softening (Probability: 10%)
Mechanics: A catastrophic global macroeconomic recession, severe geopolitical escalation, or sustained international liquidity contraction dampens foreign investment inflows. Concurrently delivered off-plan inventory in outer corridors leads to temporary tenant competition, causing peripheral rents to soften by 8% to 12% and secondary resale prices to contract by 5% to 10%. Due to the absence of mortgage debt leverage, forced selling remains minimal, preventing a structural price collapse and laying the foundation for a rapid recovery.
9. Strategic Investor Playbook: Navigating Dubai Property in 2026
For investors allocating capital in Dubai’s 2026 market, achieving superior risk-adjusted returns requires adopting a disciplined institutional playbook:
- Prioritize Master Developers with Unimpeachable Delivery Records: Allocate capital primarily with government-backed or tier-one master developers—specifically Emaar Properties, Nakheel, Aldar, Meraas, and Dubai Properties. These developers possess massive balance sheets, own prime sovereign landbanks, and command the highest secondary market resale liquidity and rental premiums.
- Target Inelastic Supply Corridors: Avoid generic, highly replicable apartment towers located in open desert zones with infinite undeveloped land. Instead, concentrate capital in natural or man-made geographic bottlenecks: beachfront islands (Palm Jumeirah, Dubai Islands, Palm Jebel Ali), Dubai Canal waterfronts, or established low-density villa enclaves (Dubai Hills Estate, Emirates Living).
- Model Conservative Financial Underwriting: Underwrite all investment properties assuming a conservative 7.0% gross yield and 80% occupancy for holiday homes, incorporating a 6-month construction handover buffer into your cash-flow models. Ensure you maintain sufficient liquid reserves to satisfy construction milestones without relying on premature off-plan flips.
- Anchor Portfolios to Long-Term End-User Demand: Focus on 2- and 3-bedroom apartments and family townhouses/villas. The fastest-growing demographic cohort relocating to Dubai consists of affluent families seeking proximity to elite private schools, healthcare centers, and established business hubs.
- Leverage the 10-Year Golden Visa: Structure property acquisitions to surpass the AED 2,000,000 threshold to secure long-term residency for yourself and your family, unlocking the full tax-free, unencumbered benefits of UAE residency.
10. Frequently Asked Questions (FAQ)
Is Dubai real estate currently in a bubble?
No. According to empirical benchmarks and the UBS Global Real Estate Bubble Index (where Dubai scores 0.64, classified as low overvaluation/fairly valued), Dubai does not display the structural characteristics of a bubble. The market is supported by 80% cash equity, record population growth, strict escrow account regulations, and robust gross rental yields of 7% to 9%.
Will property prices in Dubai crash in 2026?
A market-wide crash is highly improbable. Unlike 2008, today’s market is not propped up by speculative subprime bank debt or unchecked flipping. While generic outer-suburban apartments may experience a mild plateau or 5% to 8% rent moderation as new handovers arrive, prime waterfront and master-planned communities are projected to maintain steady capital growth.
How does Dubai’s 2026 market differ from the 2008 crash?
In 2008, 65% of transactions were financed by high-leverage bank mortgages (up to 95% LTV), there were no escrow account protections, and off-plan contracts could be flipped on a 5% deposit. In 2026, 80% of transactions are pure cash, Central Bank mortgage caps require 20% hard equity, project escrow accounts ring-fence 100% of construction funds, and the DLD mandates 30% to 40% paid equity before resale is permitted.
Is Dubai facing a real estate oversupply in 2026–2027?
No. While headline project launch figures seem high, historical delivery realization rates show developers deliver only 60% to 70% of scheduled units on time. With Dubai’s net population expanding by over 110,000 residents annually under the Dubai 2040 Urban Master Plan, organic housing demand requires roughly 50,000 new units every year, keeping physical supply and demand in healthy equilibrium.
What are the safest real estate segments to invest in Dubai right now?
The most resilient asset classes are beachfront and waterfront developments with strictly limited land availability (Palm Jumeirah, Dubai Islands, Bluewaters), master-planned low-density villa communities (Dubai Hills Estate, Tilal Al Ghaf), and prime central urban apartments (Downtown Dubai, Business Bay) built by tier-one master developers.
Navigate Dubai’s Real Estate Market with Institutional Precision
Cut through market speculation with audited transaction intelligence and master-developer allocation strategies. Contact Vintage Luxe’s private client advisory desk to structure your prime property acquisitions, analyze net cash yields, and secure your 10-Year UAE Golden Visa with absolute confidence.



Comments are closed